Handouts: Spanish immersion at Atkinson
Two slides for social media, and where their numbers come from
These two slides are for sharing on social media. They show what Scenarios A and B would do to Spanish immersion at Atkinson Elementary and across Portland. Unlike the rest of this site, the slides take a side: they ask PPS to keep Spanish immersion at Atkinson. Every number on them comes from this site’s data or from the estimate described below.
To save a slide, open it and save the image. Each slide is 1080 × 1350 pixels, the size Instagram uses for portrait posts.
Atkinson: “Don’t push Spanish immersion to the edge”
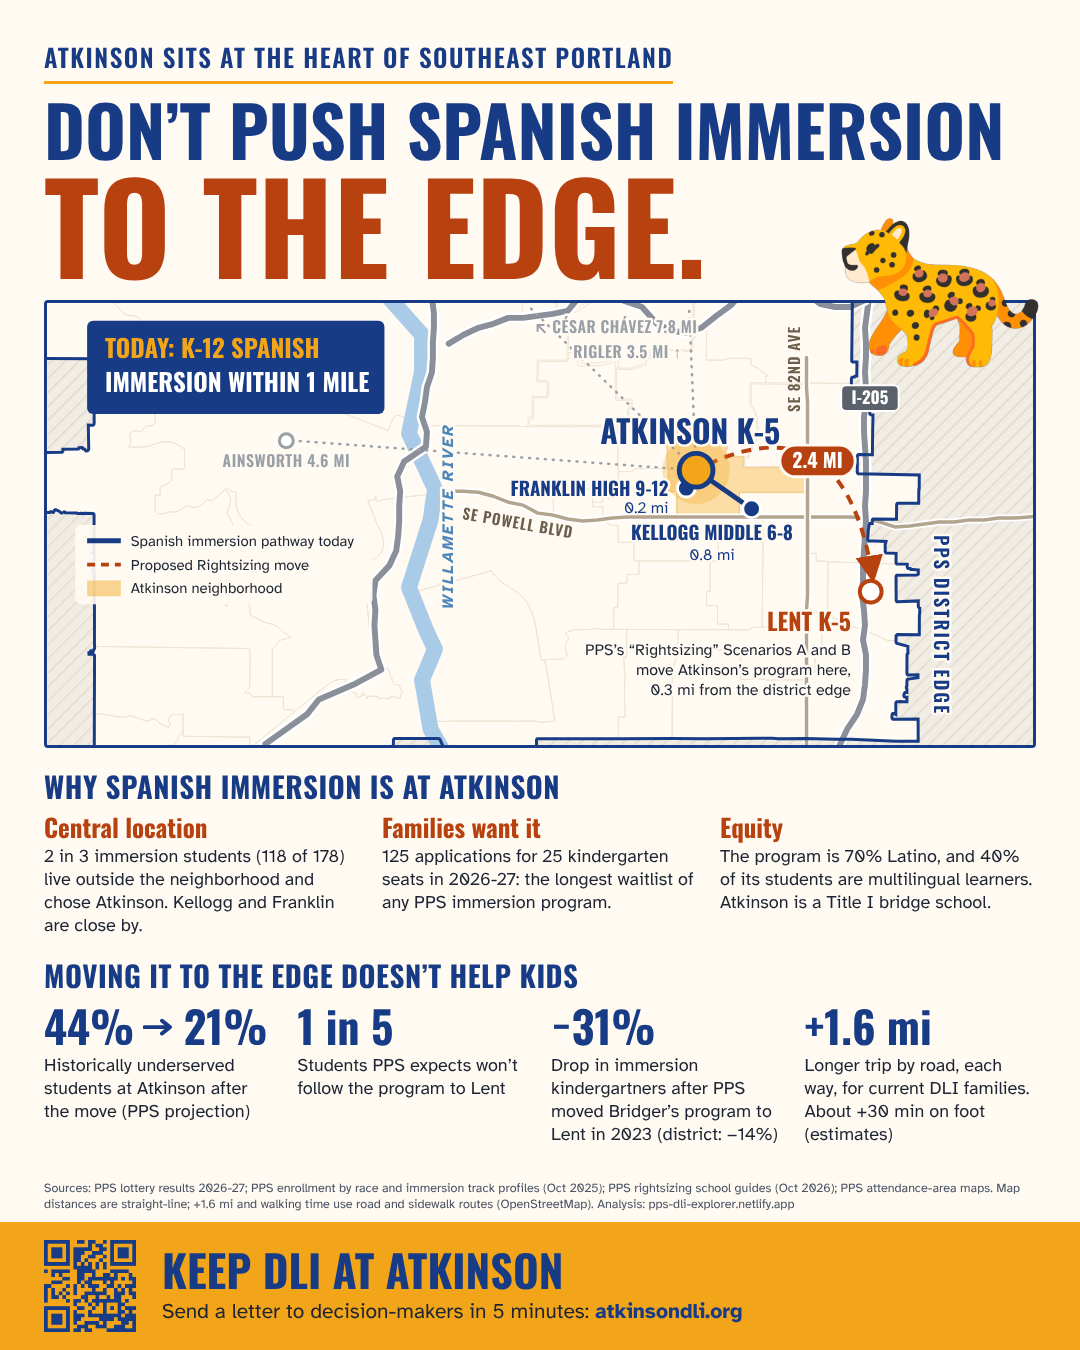
Where the numbers come from
- 2.4 miles to Lent, 0.3 miles from the district edge: straight-line distances on PPS’s attendance-area maps (Equity §4).
- 125 applications for 25 kindergarten seats: Atkinson’s 2026-27 kindergarten lottery had 125 applications and 25 offers. Its waitlist, 47 families, was the longest of any immersion program (Demand). One family can apply to several schools.
- 70% Latino, 40% multilingual learners: PPS’s October 2025 enrollment by race and program (Equity §3).
- 44% → 21%: PPS projects Atkinson’s share of students from underserved racial groups. It is 44% with no changes and 21% after the move (School changes §1).
- 1 in 5 won’t follow: PPS doesn’t state this number. Its own projections imply it: about 4 in 5 students in Atkinson’s program arrive at Lent (Equity §5).
- −31% vs. −14%: Spanish immersion students per grade at Bridger and Lent before the 2023 move, compared with Lent’s kindergartners after it. The district fell 14% measured the same way. Both are estimates (Demand).
- +1.6 miles, about +30 minutes on foot: our road and sidewalk estimate for today’s Atkinson immersion families. The trip to Lent would be 1.6 miles longer by car and 30 minutes longer on foot, each way. This is an estimate, not a measured distance (see below).
Sources: PPS Enrollment & Transfer, 2026-27 Kindergarten Lottery Results Summary (prior lottery results); PPS, Enrollment Summary by Race and Ethnicity, October 2025 (separate rows for each school’s immersion and neighborhood programs; PDF), retrieved October 11, 2026; PPS, How Could Your School Be Impacted? school guides (per-school PDFs dated October 8, 2026), page 4, “Who would the school serve?”, column “Underserved racial groups”, with no changes and under each option (page); PPS, Rightsizing Update: Scenario Release board memo, October 5, 2026, pp. 1–2 (BoardBook); travel by road and on foot: our estimate. Atkinson’s Spanish immersion students are placed by where they live (PPS Enrollment by Neighborhood of Residence, 2025-26), then routed on OpenStreetMap with OSRM (driving without traffic: router.project-osrm.org; walking and biking: routing.openstreetmap.de), one way, retrieved October 18, 2026 (data and method). Method details: Sources & methods.
Across Portland: “Spanish immersion, farther from families”
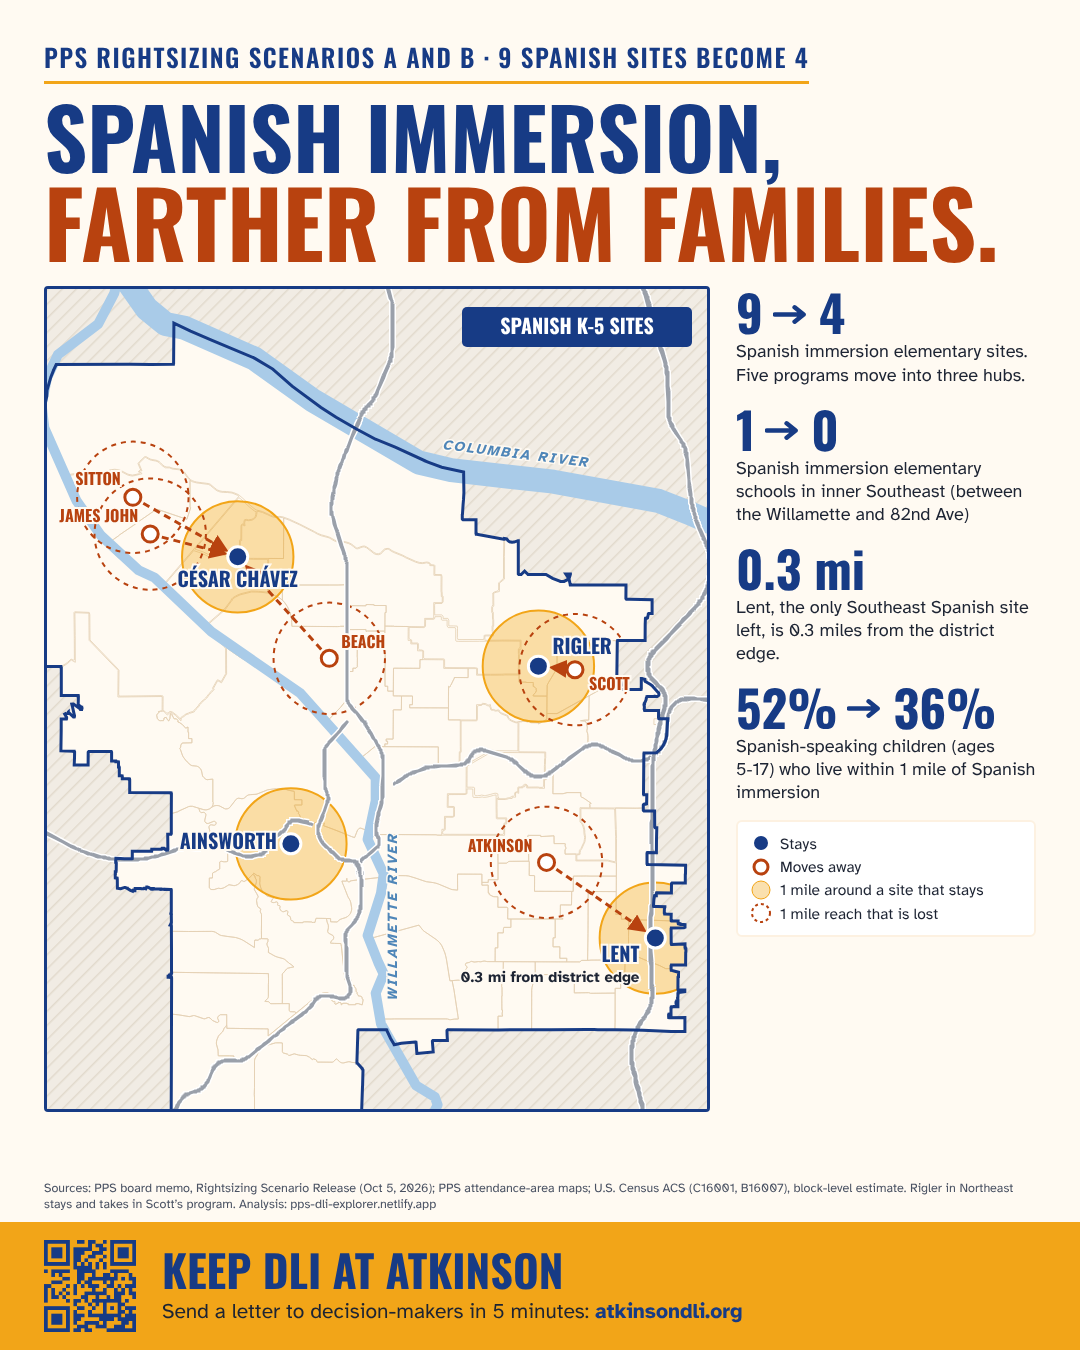
Where the numbers come from
- 9 sites become 4: in both scenarios, Sitton, James John and Beach move to César Chávez, Scott moves to Rigler, and Atkinson moves to Lent. PPS’s scenario release memo lists the moves (Demand).
- 1 → 0 in inner Southeast: Atkinson is the only Spanish immersion elementary site between the Willamette River and 82nd Avenue. Lent is east of 82nd.
- 52% → 36%: Spanish-speaking children ages 5-17 who live within 1 mile of a Spanish immersion elementary site, from census data placed on city blocks (Demand). Methods gives the 90% ranges for this estimate.
- 0.3 miles from the district edge: straight-line distance on PPS’s attendance-area maps (Equity §4).
Sources: PPS, Rightsizing Update: Scenario Release board memo, October 5, 2026, pp. 1–2 (BoardBook); PPS, How Could Your School Be Impacted? school guides (“PPS Family-Friendly School Guide”, per-school PDFs dated October 8, 2026), page 4, projected enrollment 2027-28 to 2031-32 (page); US Census Bureau, American Community Survey 2020–2024 5-year estimates, tables C16001 and B16007, census tracts in Multnomah, Washington and Clackamas counties; US Census Bureau, 2020 Census redistricting data (P.L. 94-171), tables P1 and P3, census blocks. Method details: Sources & methods.
About the travel estimate
The road and walking figures on the Atkinson slide are our estimate, not PPS’s. We placed Atkinson’s Spanish immersion students by the area where they live, from PPS’s report on where students live. Within each area, we spread them out the way children ages 5-17 are spread across census tracts. Then we asked OpenStreetMap’s routing service for the trip to Atkinson and to Lent. Driving times assume no traffic. Real trips depend on where each family lives, traffic and the route a family takes. The data and method are on GitHub.
Sources: PPS, School Enrollment by Neighborhood of Residence, October 2025 (PPS Data & Reporting); travel by road and on foot: our estimate. Atkinson’s Spanish immersion students are placed by where they live (PPS Enrollment by Neighborhood of Residence, 2025-26), then routed on OpenStreetMap with OSRM (driving without traffic: router.project-osrm.org; walking and biking: routing.openstreetmap.de), one way, retrieved October 18, 2026 (data and method). Method details: Sources & methods.